NEW 2024 Consumer Fraud Report: Just how bad is returns abuse? We've got the data.


2023 // FALL EDITION

The Ecommerce Returns Benchmark Report: Fall 2023


The biggest ecommerce returns digest is here again — and just in time for Peak Season.


2,500 ecommerce brands. 14M+ returns. All wrapped up and analyzed in one easy-to-read report.


Get the latest edition of The Ecommerce Returns Benchmark Report to see:


  • 🤔 How your return stats compare to other brands in your vertical
  • đź“Š Macro-level ecommerce return trends
  • 📉 What brands are doing to reduce return rates
  • đź’Ž How you can create a world-class shopping experience with returns

Loop Benchmark Report Thumbnail Graphic

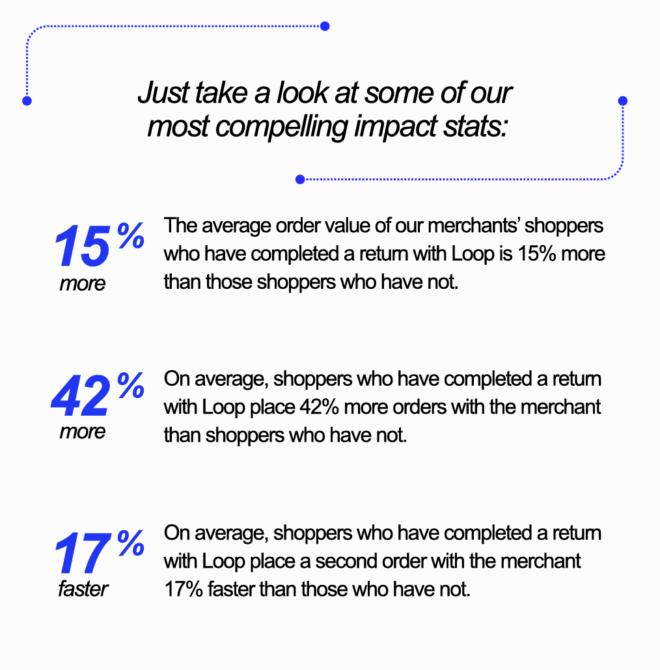
Loop Impact Stats Main Graphic

The most robust returns report in ecommerce

2500 brands | 14.7M returns

Dive in and see how refund rates, retention rates, and upsell value per return break down across industry verticals. Apparel, footwear, accessories, and more—you’ll find them all here.

Plus, you’ll get a peek into the essential retention strategies driving success from top performing merchants.

automated returns

Unlock the secret to retention

Ecommerce sales are expected to total $1.4 trillion in the US this year. With an average return rate of 16.5%, that’s over $231 billion in returned merchandise in 2023 alone. Which means ecommerce brands have the unique opportunity to transform an often dreaded result into retained dollars and customers.


Don’t just take it from us—not only do Loop merchants see a lower return rate overall, they retain revenue on 28.6% of their returns, and generate an average of $1.59 in upsell value per return. Who said returns always have to mean money coming out of your pocket?

Returns aren’t one-size fits all.
So why is your platform?

It’s no mystery that Loop’s merchants enjoy the best return metrics in the industry. Let us show you how.

Personalize your returns experience at scale for fewer returns, more retained revenue, and higher customer loyalty.